
Overview
You will learn
- How to install MDK Extension in Visual Studio Code
- How to generate a debug configuration file
- How to set breakpoints in a rule
- How to use the debug console


Prerequisites
Prerequisites
- Tutorial: Set Up Initial Configuration for an MDK App
- Download and Install Visual Studio Code from here
- Download the latest version of mobile development kit SDK either from the SAP community trial download or SAP Software Center if you are a SAP Mobile Services customer
Steps
Intro
Use the debugging feature provided by the mobile development kit extension for Visual Studio Code to debug your MDK app after bundling it. You can set breakpoints, inspect scope variables, watch expressions, or execute JavaScript code in the rule files.
This step includes creating the mobile development kit project in the editor. Follow steps 1 and 2 from this tutorial to create your MDK project and deploy to mobile services.
Close the onboarding QR code window, as it is not needed for this tutorial.
You will download your MDK project to your local machine. This will be necessary for setting a breakpoint in a rule file in step 9. An alternative option is to use a GitHub repository. See Git Source Control guide for more details.
In SAP Business Application Studio, make sure not to select any file or folder under Explorer, right-click on the blank area and select Download.

BAS Explorer Right-Click Download Option A file named
MDKApp.tarwill be downloaded to your machine. Extract the metadata files from the downloaded archive.
Follow the Build Your Mobile Development Kit Client Using MDK SDK tutorial to create your branded MDK client and run it on a simulator or a device.
After successfully onboarding your mobile client, click Now to accept the app update.
Leave the client running. You will connect the debugger to this client in step 9.
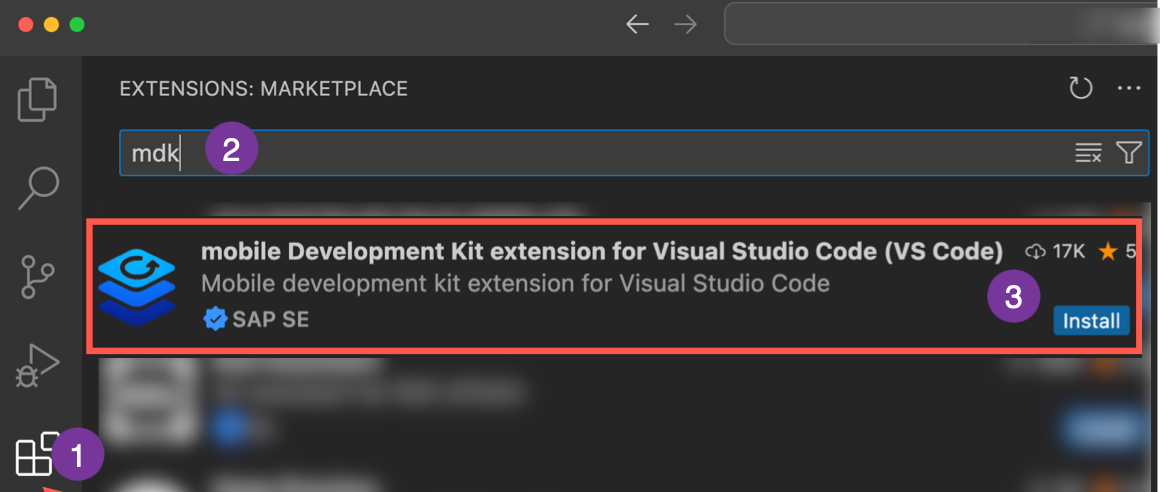
In the Visual Studio Code, click the Extensions pane and install the Mobile Development Kit Editor extension. Alternatively, you can download and install the MDK extension for VS Code from the SAP Software Center (applicable to SAP Mobile Services customer).
Open the extracted mdkapp folder in the VS Code.

You will add your debug configurations in launch.json file.
To generate the default launch configuration file, select Run and Debug in the icon panel.
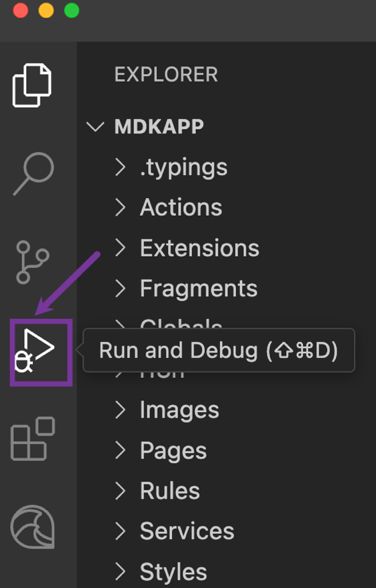
VS Code Run And Debug Panel Selected Click
create a launch.json fileoption.
Create Launch JSON File Option Select
MDKas the debugger type from the list.
MDK Debugger Type Selection A
launch.jsonfile will be generated.
Generated Launch JSON File In the
launch.jsonfile, set theappRootattribute for appropriate mobile development kit launch configurations. This should be the path to yourcreate-clientcommand output.If you have launched your MDK branded client from terminal or command line via
ns run iosorns run androidcommand, you do not need to set theappRootattribute for MDK Launch configurations. You can only set theappRootattribute for MDK Attach configurations.Put a comma after
watchattribute and addappRootattribute. Provide the path to your MDK client project folder.
Launch JSON AppRoot Attribute Configuration
Make sure you are choosing the right device platform tab above.
You can debug Android clients from either Window or Mac. iOS clients can only be debugged using a Mac.
Select the MDK Attach on Android configuration from the drop-down, and click the green play icon or select Run Menu > Start Debugging.

MDK Attach Android Configuration Selected In this tutorial, MDK client was launched via terminal or command line window back in step 4. So, the MDK Attach configuration option is selected in the dropdown.
Once the debugger is attached to your MDK client, you will see an orange bar appearing in the VS Code.

Debugger Attached Orange Bar VS Code Android
Select the MDK Attach on iOS configuration from the drop-down, and click the green play icon or select Run Menu > Start Debugging.

MDK Attach iOS Configuration Selected In this tutorial, MDK client was launched via terminal window back in step 4. So, the MDK Attach configuration option is selected in the dropdown.
click allow accepting incoming network connections.

Allow Incoming Network Connections Dialog Once the debugger is attached to your MDK client, you will see an orange bar appearing in the VS Code.

Debugger Attached Orange Bar VS Code iOS
As the debugger is attached, you can now set breakpoints, inspect scope variables, watch expressions, or execute JavaScript code in the rule files.
Make sure you are choosing the right device platform tab above.
Switch to the Explorer view to access MDK project.

Explorer View MDK Project Access To set a breakpoint, navigate to
Rules|com_sap_edm_sampleservice_v4|Customers|Customers_DeleteConfirmation.jsand click on line 8 where you want to set your breakpoint. Click the margin that you can find on the left of the line number. Alternatively, you can toggle the breakpoint from Run menu > Toggle Breakpoint.
Setting Breakpoint In Rule File Android In your MDK client, navigate to Customers | click on any customer record | More | Delete to trigger the rule.

MDK Client Customer Delete Action Android Click OK to confirm.

Delete Confirmation OK Dialog Android Execution stops at the breakpoint.

Execution Stopped At Breakpoint Android Use debugging capabilities in VS code to step over or into code, inspect variables, set watch points, and more. See the Visual Studio Code documentation on Debug actions, breakpoints, Data inspection and Advanced breakpoint topics.
Switch to the Explorer view to access MDK project.
Explorer View MDK Project Access iOS To set a breakpoint, navigate to
Rules|com_sap_edm_sampleservice_v4|Customers|Customers_DeleteConfirmation.jsand click on line 8 where you want to set your breakpoint. Click the margin that you can find on the left of the line number. Alternatively, you can toggle the breakpoint from Run menu > Toggle Breakpoint.
Setting Breakpoint In Rule File iOS In your MDK client, navigate to Customers | click on any customer record | More | Delete to trigger the rule.

MDK Client Customer Delete Action iOS Click OK to confirm.

Delete Confirmation OK Dialog iOS Execution stops at the breakpoint.

Execution Stopped At Breakpoint iOS Use debugging capabilities in VS code to step over or into code, inspect variables, set watch points, and more. See the Visual Studio Code documentation on Debug actions, breakpoints, Data inspection and Advanced breakpoint topics.
Let’s check if there is already
result.dataavailable. Switch to the DEBUG CONSOLE tab, enterresult.dataand press enter.
Debug Console Result Data Query As
result.datais true, theCustomers_DeleteEntity.actionwill be executed when pressing the play icon on the Debug Toolbar.
Debug Toolbar Play Icon Delete Action To disconnect your debugger, click the red stop icon in the floating bar. Alternatively, you can do it via Run menu> Stop Debugging.
You have learned how to debug an mobile development kit client application. Find more information about debugging in MDK in help documentation.
Resources
Discussion
Share feedback on this tutorial or join the conversation in SAP Community.